I’ll consider central banking in reference to two periods: the interwar banking crisis and Great Depression, and the recent financial crisis and Big Contraction. I’ll compare the depth of these crises in terms of output loss, and of central banks’ reaction: this will be done from a pretty unusual perspective, that is looking at their balance sheet. I’ll consider three specific central banks: US, UK and Italy’s. They are good examples of sometimes different approaches to financial crises.
1. PAST AND PRESENT: SOME COMPARISONS
Let’s start by giving some figures regarding the depth of the Great Depression, in terms of real output, in these major countries: the US, UK and Italy.
Table 1. GDP in the Great Depression
Sources: US: Bureau of Economic Analysis; UK: Bank of England; Italy: Mitchell (1981)
The Depression hit the US more severely, with a cumulative -29.5% in four years, than Britain or Italy: -5.9 and – 9.0%, respectively. After two years, their national product started recovering .
The recent Big Contraction, so far, has been less deep in the US, but the economies of the other two countries have been affected to an extent not far from the 1930s’. In addition, recovery has been so far tentative, sluggish, in the US, and almost non-existent in the other two countries.
Table 2. GDP in the recent Contraction
Source: IMF(WEO)
It is now a well accepted view that, in an incoming recession, pro-reactive macroeconomic policies should stimulate aggregate demand by fiscal and monetary measures. To stay within our theme, we shall focus mainly on the second category of measures: on policies adopted by central banks in front of a deteriorating economic performance. But let me also briefly mention budget policies, which give an immediate idea of how differently governments have reacted to the crisis, in the interwar period and today.
Table 3. Government deficits, as % of national output[2], in the 1930s and in the recent turmoil
Sources: 1930s: US, Office of Management and Budget; UK and Italy, Mitchell (1981); 2000s: IMF(WEO)
The US is a good example. In 1932, the worst year of the Great Depression, the US government deficit was a meager 4% of GDP (in the same year, the discount rate, in real terms, was at the prohibitive level of almost 14%[3]). By contrast, in 2009, the worst year of the recent contraction, the federal deficit was 13% of GDP (while the “federal funds” rate stood close to zero, and the Fed had started already in 2008 a policy of “quantitative easing”- QE, buying large quantities of securities and loans to stimulate the economy; this QE1 has been followed by QE2 in 2010 and more recently, in 2012, by QE3).
The UK kept in the 1930s an almost perfectly balanced budget.
The enormous expansion of government deficits in recent years, as compared to the different trend in the 1930s, is evidence of “Keynesian” activism, of faltering revenues due to recession, and of huge bail-outs of financial institutions.
Italy’s reaction in the recent crisis is remarkably different from US and UK’s, and shows a paradox: Italy has suffered the biggest yearly fall in output (among the three countries), even though the banking crisis has had a lesser relevance. The collapse of the Italian output has been due to structural, “real” weaknesses of its economy, not to financial distress. To address these long-dated structural problems the reduction of public debt – currently at more than 120% of GRP – is a priority. This explains the declining trend of the Italian government deficit in recent years and why, this year, the government aim is to stay below 3% of GDP.
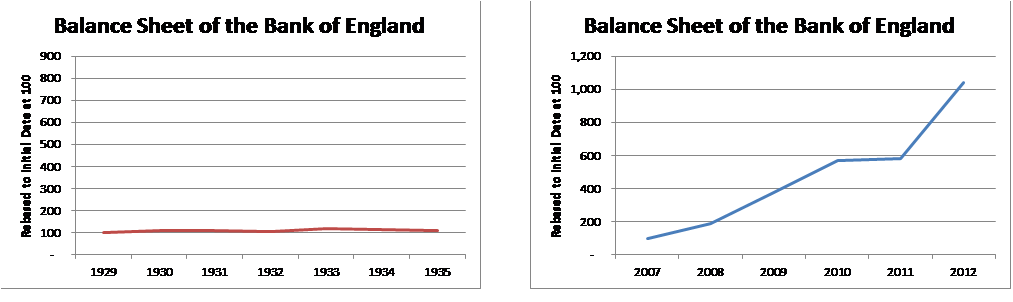
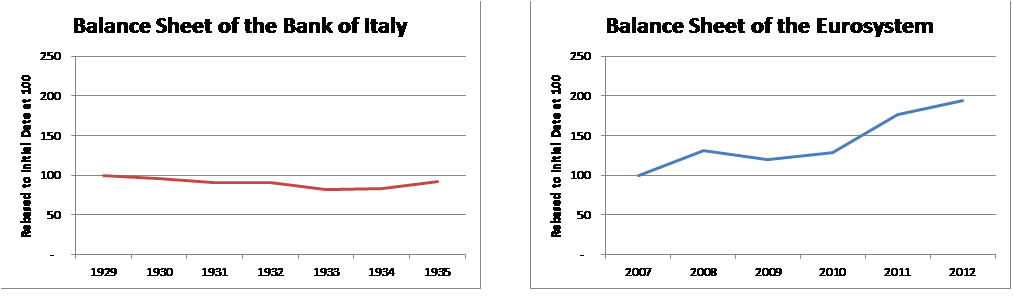
Now we turn to monetary policies. A good approach to this issue is to look at central banks’ balance sheet in the two crises: we shall look at the US Federal Reserve and the Bank of England; then, at the cost of forcing our comparison, we shall take the balance sheet of the Bank of Italy for the 1930s crisis, while for the recent crisis we shall consider the Eurosystem’s, because this is now the relevant aggregate for monetary policy purposes.
Fig 1. Balance sheets of the Federal Reserve, the Bank of England, the Bank of Italy, the Eurosystem (starting year=100)
|
FedReserve 1929-35 |
FedReserve 2007-12 |
 |
|
Sources: FedReserve Bulletins; FedReserve Flow of funds
|
Bank of England 1929-35 |
Bank of England 2007-12 |
 |
|
Sources: Federal Reserve: Banking and Monetary statistics 1914-1941; Bank of England Annual Reports
|
Bank of Italy 1929-35 |
Eurosystem 2007-12 |
 |
|
Sources: Banca d’Italia (1993); ECB Bulletins
It is noticeable how differently central banks reacted in the two crises. It’s immediately evident how flat is the curve of balance sheet’s total in the 1930s. In the 2000s, we see an enormous expansion both in the Fed’s and still more in the BoE’s balance sheet. More subdued has been the Eurosystem’s growth.
Given the strikingly different reaction of central banks in the two crises, we may raise two related questions:
a) How has the “art of central banking” evolved?
b) Is central banking an “art”, governed by discretion, or a “science”, governed by “rules”? In other terms, can central bank activity be rigorously defined by regulation, which embodies what “economic science” says, or should it rely mostly on the banker’s judgment? (an extreme view of discretion – or a joke? – is Montague Norman’s[4] position: he allegedly said to his chief economist: “your job is not to tell me what to do, but to explain me why I did that”).
2. YESTERDAY’S CRISIS: THE GREAT DEPRESSION
To answer the first question, we should have in mind the institutional framework of the two crises. Until the mid 1930s, the central banking “mantra” was the gold standard. Its basic, unwritten rule was that money supply should be contained, to avoid inflation[5]. What does “contain” mean? Containment meant, in the gold standard, to maintain the convertibility of national currency into gold at a fixed rate: the amount of currency (simplifying, of banknote circulation) could not exceed a multiple of gold in the central bank reserve. This ratio was determined – in general, by legislation – as a minimum percentage of the gold cover of circulation: often, but not necessarily, 40%.
A variation was the gold exchange standard, where gold could be supplemented by “hard” currencies in the central bank’s reserve: this of course permitted a corresponding expansion of money supply.
To comply with this rule, the “art” of the central banker consisted in keeping that ratio above that percentage – or, as Bagehot wrote, above the “apprehension” minimum.[6] Approaching this apprehension threshold, the central bank had either to deflate, i.e. reduce circulation and money supply, or to increase the amount of gold in reserve. Deflation was achieved by tightening credit conditions (and fiscal policy), at the cost of resource unemployment and output contraction. Gold accumulation might be even harder to achieve: by a surplus in the balance of payments, with a consequent inflow of gold, but this often meant to squeeze domestic demand. In extreme difficulty, rather than increasing the physical stock of gold, a country would increase the price of gold in terms of national currency (i.e., decrease the gold content of the national currency: substantially, a currency devaluation).
To make this point more clear by an example, let’s take the case of Italy after the First World War. The huge war expenditure had debased the Italian currency – that is, had increased money supply well beyond what the gold and foreign exchange reserve of the Bank of Italy would allow. Consequently, Italy had to abandon the gold standard and lira became inconvertible into gold. However, at the end of 1927 Italy, largely for reasons of prestige and anyway following the “mainstream”, returned to gold convertibility, by: 1) deflating the money supply, i.e. reducing currency in circulation; 2) lowering the lira gold content (it was: 1 lira = 290.3 milligram of fine gold; it became: 1 lira = 79.2 milligram of fine gold).
Here we compare figures for gold and foreign exchange in reserve (Italy was on a gold exchange standard basis), and banknote circulation, before and after the “return to gold”, that is: in 1926 and 1928. In between the two years, circulation was deflated (see B), while the lira gold content was reduced (the lira was devalued in terms of gold) and foreign currency in reserve was raised through international loans (see A). The gold/circulation ratio (A/B) increased as a consequence from 13% to 74%.
Table 4. Bank of Italy: reserve and circulation (1926-1928, bln lire)
| 1926 | 1928 | |
| A) gold and foreign exchange | 2.4 | 12.8 |
| B) banknote circulation | 18.8 | 17.3 |
| A/B) | 13% | 74% |
Source: Banca d’Italia (1993)
We can notice that, even though Ralph Hawtrey titled his book “The Art of Central Banking” (1932), the options available to central banks in a gold standard regime were pretty limited. In the debate “rules versus discretion”, the “science” called economics had defined the rules of the game, and these rules were strict enough to leave to the central bank just a narrow path, a restrictive bias.
Hawtrey, to be sure, spoke of “art” for the simple reason that he compared central banking in his times (the 1920-30s) with a previous 19th century monetary standard, as conceptualized by David Ricardo, whereby the national currency was “based exclusively on a specie standard (the use of coins as hand to hand currency) [and] the central bank would be absolutely dependent upon its reserves of coin to meet any increased demand for currency” (p 117): the most pure, rigid form of gold standard (gold specie standard). By Hawtrey’s times, this wasn’t any more the case, so the central bank, with the right to issue banknotes and act as lender-of-last-resort, had to be mindful not to create “too much” supply of money.
If we look at the Bank of Italy’s balance sheet in 1928, after Italy’s restoration of gold standard, there are other interesting features:
Table 5. Balance sheet (asset side) of the Bank of Italy 1928 (bln lire)
| Gold and foreign exchange | 12.8 | 57% |
| Advances to the Treasury | 0 | |
| Discount/advances to banks | 5.5 | 24% |
| Treas. securities (incl T-bills) | 1.3 | 6% |
| Istituto di Liquidazioni | 1.2 | 5% |
| Other | 1.7 | 8% |
| Total assets | 22.5 | 100% |
Source: Banca d’Italia (1993)
The non existence of “advances to the Treasury” testifies for one of the canons of a gold standard central bank, the independence from the Treasury, the prohibition to lend to it; the limited amount of Treasury securities in its portfolio is an indication of an underdeveloped financial market for open-market operations (purchase and sale of securities for money supply control); the intervention in bail-out operations is shown through the item “Istituto di liquidazioni”. Istituto was the “special purpose vehicle” (in current parlance) that the Bank used during the banking crisis of early 1920s, in order to formally separate these “exceptional” bail-out interventions from its “ordinary” activities (a practice similar to the Fed’s, today, when various “vehicles” with fancy names, as “Maiden Lane”, have been created to bail-out the most diverse financial institutions and activities) .
Such were the constraints of central banks, that even the country with the largest gold reserve and surpluses in its balance of payments, the US, under the gold standard adopted a restrictive monetary stance, despite the serious deterioration in its economic performance, as we have seen. Fig 1, above, shows that a similar pattern was adopted in the same period of the Great Depression by the UK and Italy. Their central banks’ balance sheets remained basically flat, even though Britain suspended gold standard in 1931 and the US devalued the dollar in 1933-34 (Italy kept the standard, together with other countries, like France, until 1936: the so called “Gold Bloc”).
Gradually, Keynes’ works, an evolving socio-political climate, and economic distress, led eventually to the demise of the gold standard, and to the widely shared conclusion that, in Richard Sayers’ worlds, “working to rule is the antithesis of central banking”. Sayers criticized “the Ricardian view that the nation had decided…that the value of the monetary unit should be made to depend upon the word value of gold, and that the supply of money should be so closely tied to conditions on the market for gold that there should be no room for human manipulation, however well intended” (Sayers, 1957).
3. TODAY’S CRISIS: THE GREAT CONTRACTION
How has central banking evolved in today’s world? We are in a world of “fiat money”, where money is created by a central bank’s “stroke of pen”. A full discretion appears to be granted, but this would be a simplistic answer. Let us look at the three banks under consideration. Not surprisingly, their institutional framework is remarkably similar from a technical standpoint. In their legislation we find a general prohibition to finance directly government’s deficits, but of course the possibility to make transactions in government securities – buy and sell – on the secondary market (open-market operations). The main difference seems to be in the objectives of their policies. The Federal Reserve Act, Section 2A, states that the Fed shall operate “to promote efficiently the goals of maximum employment, stable prices, and moderate long-term interest rates”. In this connection, the Fed has recently (January 2013) adopted numerical targets for both inflation and unemployment rate, as a guide of its policy.
Compare this with the ECB’s strategy, according to its official documentation. It is based on the assumption that “the central bank cannot influence economic growth by changing the money supply”…”A change in the quantity of money will be reflected in a change in the general level of prices [the ECB has also an inflation target rigidly defined] and will not induce permanent changes in real variables such as real output or employment”.
The Bank of England, in its Monetary Policy Framework, states that, in addition to price stability – again, with an inflation target, however less rigidly defined – the Bank has to support the government’s objectives, including growth and employment.
Importantly, the inflation target is in the UK determined by the government, while in the Eurosystem by the ECB itself. The US is a case apart, because it is the Fed that has defined the target, but in a flexible way and together with an unemployment threshold.
Therefore – within a common framework of “discretion” – it is not surprising how the three central banks have reacted to the crisis according to their official Strategies. A very telling story of “central banking art” is the unorthodox behavior of the Federal Reserve. We have already given above the dynamics of the Fed balance sheet in both crises (Fig 1). Now we’ll see more in detail the balance sheet composition before and after the recent crisis (if “after” has a precise meaning, given the current circumstances…).
Table 6. Federal Reserve balance sheet (asset side) 2007 and 2012 (bln USD)
| Official reserve | |||||||
| Credit market instruments: | |||||||
| (Treas. securities | 740.6) | ||||||
| (GSE-backed securities | 0) | ||||||
| (Loans to banks | 0) | ||||||
| Other (inc. disc. window) | |||||||
| Total assets +195% | |||||||
Source: FedReserve Flow of funds
The main items of the balance sheet explain how the Fed decided to tackle with the menace, not only of an American recession, but of total disruption of the global financial and banking system. Of a secondary importance appear the discount window operations – the “old” lender-of-last-resort activity, providing temporary liquidity to the banking system. But the explosion is in “credit market instruments”: still in 2007, Treasury securities were “the only game in town”: T-bonds and bills as ammunition of the central bank to carry out its open market operations. In 2007, they occupy 78% of the Fed balance sheet: the core activity of a modern central bank in a financially sophisticated market (compare that with the holdings of Treasury securities by the Bank of Italy in the 1920s, in a still largely agricultural country, without a meaningful financial market: 6%). The 2.2 times increase in Treasuries between 2007 and 2012 reduces, however, their share in Fed balance sheet, while Government Sponsored enterprises-GSEs securities jump from zero to 34% .
This jump is the clear evidence of the origin and core of the American financial crisis. A very large part of GSEs securities is made of mortgage-backed securities, the instruments through which mortgage loans, and the associated risk, were spread all over the financial system. In particular, the central bank had to buy these securities to bail-out quasi-government agencies (Freddie Mac, Fannie Mae) that had amply purchased mortgage loans from lending banks.
Then, in the Fed’s balance sheet, we have the “depository institutions (banks) loans”: a relatively minor amount, 0.6 bln USD, and a small percentage of the total (however from zero in 2007), but it should be noted that, at the peak of the crisis, in 2008, this item was much bigger: 490.4 bln USD, and included a series of bail-out programs, aimed at financing ailing banks and non-bank institutions, again a very unorthodox way of central bank intervention.
What all this means? The ample purchase of Treasuries is evidence of an extremely expansionary monetary policy that, even with quasi-zero interest rates, continues to pump money into the economy: the “quantitative easing-QE”. In addition, as we have seen, in order to further ease its policy, the Fed bought large quantities of GSEs debt, which affected its balance sheet also in terms of quality, given the bankrupt state of these Entities. But in general this blowing up of the Fed balance sheet proved the effective way to limit the damages of the financial crisis and to prevent, as far as possible, a deep fall in American GDP: a panoply of interventions that would have been unthinkable in different times and monetary regimes: the “art” at its utmost (if not at its best…).
Is there a flip side? It might be found to the extent that this huge monetary expansion, rather than start-jumping the economy, ends up into a higher level of inflation. The jury is still out: so far, the post-crisis growth rate has been modest (see table 2), while inflation remains subdued, given the slack capacity in the system.
A similar pattern can be observed in the Bank of England balance sheet, as noticed at the start of these notes. Its expansion, to promote recovery and to bail-out the financial system, is still more pronounced than in the US.
A different pattern we observe in the Eurosystem: after a jump in 2008, connected to the first, violent phase of the crisis, its balance sheet contracted in 2009, barely changed in 2010, then grew substantially in 2011. Why?
To explain this we have to move to another important central bank, the German Bundesbank. For more than 20 years, between the mid-1970s and the mid-1990s, the Bundesbank “has conducted its policy under the banner of public monetary growth targets” (Neuman, 1999). The bank essentially accepted Milton Friedman’s monetarist view. Even though the growth target of money supply was rather nebulously formulated, the bank was no longer “a self-service shop” for banks. In this, it was facilitated by the transition from fixed to floating exchange rates after the dollar devaluation of early 1970s, that made possible a more independent monetary policy. It is widespread opinion that monetary targeting – based on a money supply policy oriented to the medium term and allowing deviation from the envisaged growth rate in the short term – proved its worth. Above all, monetarism created in Germany a stability culture, that has been successfully brought into the new Eurosystem. In the ECB’s Monetary Policy Strategy, mentioned above, it is not difficult to find policy attitudes of the German central bank.
In fact, the more modest expansion of the Eurosystem balance sheet (in comparison with the Fed or the Bank of England’s) (Fig 1) can be partly explained by the fact that the European banking system has been less severely affected by the huge asset quality deterioration that characterized the Anglo-Saxon banks, albeit with relevant exceptions. But the “Bundesbank legacy” is also present (BB as a template for the Eurosystem)
The different features of financial systems in America (a market-oriented system) and continental Europe (a bank-oriented system) are reflected in the components of central banks’ balance sheet. While, in facing the crisis, in the US the Fed has largely relied on security purchases, in Europe the Eurosystem has mainly intervened through an increase in its lending to banks (so far).
It’s interesting to observe that, even after a wide expansion of its balance sheet, the FedReserve balance sheet stays now at around 20% of the American GDP, while the Eurosystem’s at around 33%. This comparison, however, does not take into account that the Eurosystem’s is the consolidated balance sheet of ECB and all the full central banks of the euro-area: a situation quite different from the US, where the regional FedReserve Banks cannot be considered as fully-fledged central banks.
Table 7. FedReserve and Eurosystem balance sheets 2012: a comparison
| Official reserve | ||||
| Treas. and GSE securities | ||||
| Loans to banks | ||||
| Other | ||||
| Total assets | ||||
Sources: FedReserve flow of funds; ECB Bulletin
Eurosystem’s lending has, in more recent times, greatly increased under Draghi’s presidency, doubling in one year time. In particular, long-term-refinancing-operations (LTRO) take a large part of “loans to banks” (1035.8 bln). And it’s only of a few months ago the ECB decision to embark in an “unlimited” purchase of Treasury securities of “peripheral” euro-area countries, under certain conditions (the Outright Monetary Transaction-OMT program): a controversial move, seen by most observers as a smart step to save the euro, by others as a sign of politicization of the ECB, away from the Bundesbank imprint. (in our scheme, we might say “a smart step towards discretion”, while the BB critical attitude would be “a defence of the rules”).
To comment on this decision would bring us to consider the peculiar twist that the financial and economic crisis has taken in Europe, becoming a crisis of government debt and, as a consequence, of the euro itself. In front of the current Sovereign crisis, an interesting question is whether the OMT should be seen as consistent with a sound monetary policy conduct. We know there are different opinions and we shall not dwell upon them. But, as just said, it is possible to see in the debate an echo of our “rules” versus “discretion” alternative.
Should the central bank always comply with the rule of maintaining only top quality assets in its balance sheet, or should it have the discretion to buy volatile or unsafe assets for the sake of a superior goal?
Has a “clean” balance sheet a specific meaning in a world of “fiat money”, where central bank liabilities are not convertible into a commodity (gold)?
Why to focus on “peripheral” countries only, if OMT are to be made for monetary policy purposes?
Is the goal of OMT program to save the euro, or to bail out a State, or both?
Is central bank independence at risk?
4. CONCLUSION
A simple quantitative analysis of central banks policies in the Great Depression and in the recent Big Contraction shows how the framework of their activities has greatly changed, and how different from the interwar period their reaction has been. Rules have given room to discretion, and activism is particularly visible in Anglo-Saxon central banks, partly because their banking industry has been hit more severely. The Eurosystem seems to have kept a more restrained attitude, has been more inclined to tilt towards the monetarism of the main central bank in Europe; even though, under a deepening recession in euro-area countries, new policies are now being pursued.
In the light of all this, is central banking an art? I am not hesitant to say yes. It almost never – even under the gold standard – went on an automatic pilot, and I don’t see signs it could go that way. A central banker, in spite of any personal belief, cannot be a “mainstream” economist. Not being a “science”, central banking needs “opinions”. This is, of course, a potential threat to its independence: but to consider this point would require another seminar.
References
Bagehot, W., Lombard Street, John Murray, 1931 (first ed 1873)
Bank of England: www.bankofengland.co.uk
Bank of England Annual Reports
Bank of England, Monetary Policy Framework
Banca d’Italia, I bilanci degli istituti di emissione, Laterza, 1993
Bureau of Economic Analysis: www.bea.gov
European Central Bank Bulletins
European Central Bank, Monetary Policy Strategy
Eurostat: www.ec.europa.eu/eurostat
Federal Open Market Committee, Statement on Longer-Run Goals and Monetary Policy Strategy, 29 Jan 2013
Federal Reserve Bulletins
Federal Reserve Flow of funds
Federal Reserve, Banking and Monetary Statistics 1914-1941, 1943
Hawtrey R., the Art of Central Banking, Longmans, Green, 1932
Historical Statistics of the United States, Cambridge, 2006
International Monetary Fund, World Economic Outlook: www.imf.org
Mitchell B.R., European Historical Statistics, Macmillan, 1981
Office of Management and Budget: www.whitehouse.gov
Neuman M., Monetary Stability: Threat and Proven Response, in Deutsche Bundesbank, Fifty Years of the Deutsche Mark, Oxford, 1999
Ricardo D., The Principles of Political Economy and Taxation, Dover, 2004 (first ed 1817)
Sayers R.S., Central Banking after Bagehot, Oxford, 1957
Sheppard D.K., The Growth and Role of UK Financial Institutions, Methuen, 1971
Note
1. This text is based on two seminars recently held at the Buckingham University, UK and at LUISS-Guido Carli in Rome. I am grateful to Pierluigi Ciocca, Robert Pringle and Geoffrey Wood for their thoughtful comments. ↑
2. GDP, but GNP for UK and Italy in the 1930s. ↑
3. Historical Statistics of the United States. ↑
4. The Bank of England governor in the 1930s. ↑
5. This rule was translated in different ways into central banks’ statutes. ↑